
How to use
Upload a spreadsheet, and a finished report comes back in about 90 seconds, with every figure calculated from your own data.
How to use
Five steps, and four of them are you clicking once
Nothing to install, nothing to configure, and no template to fill in first.
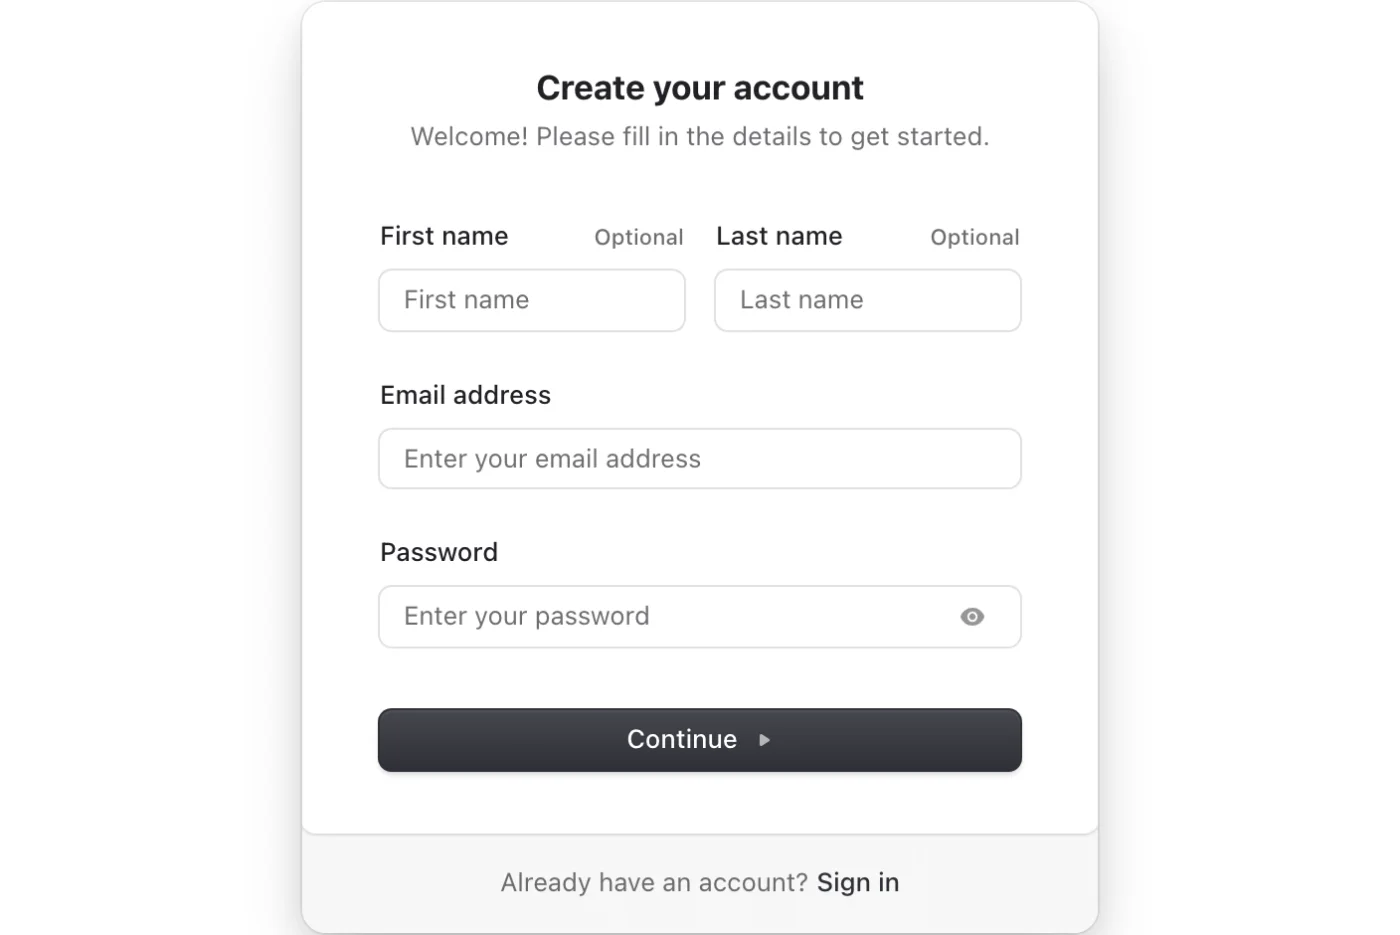
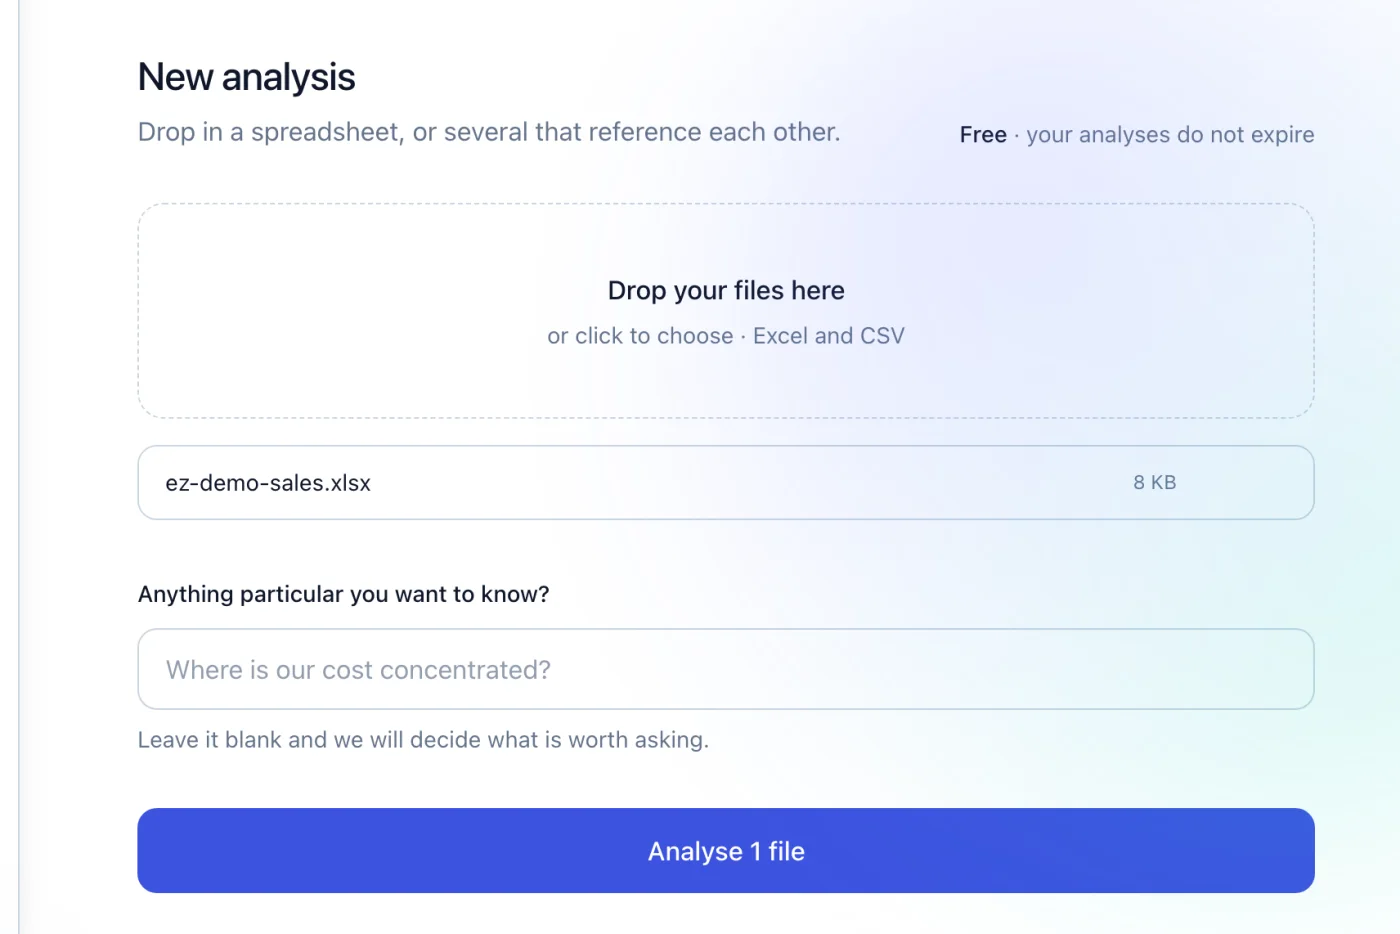
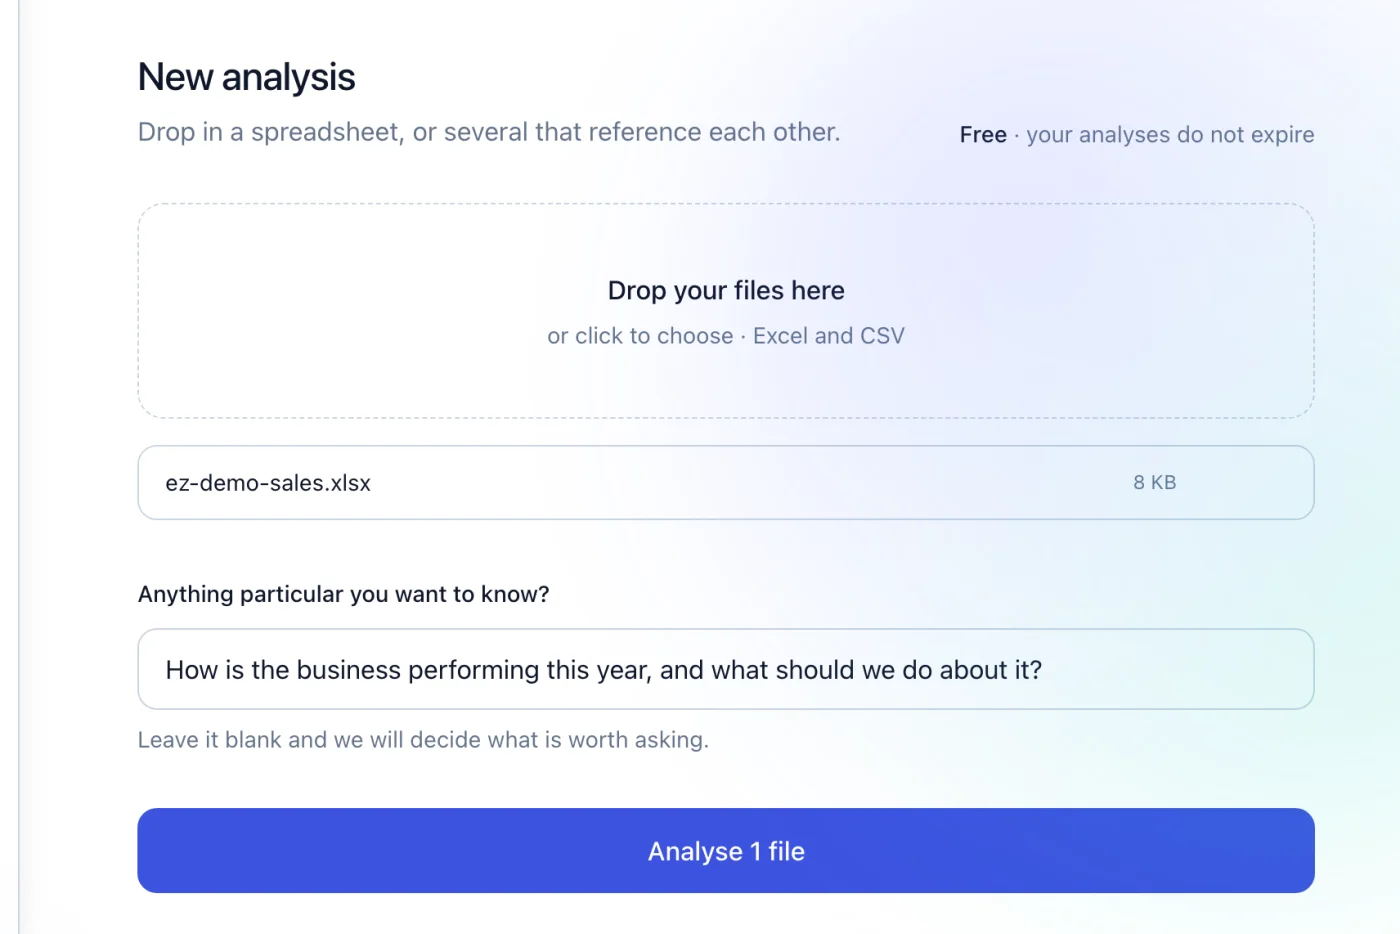
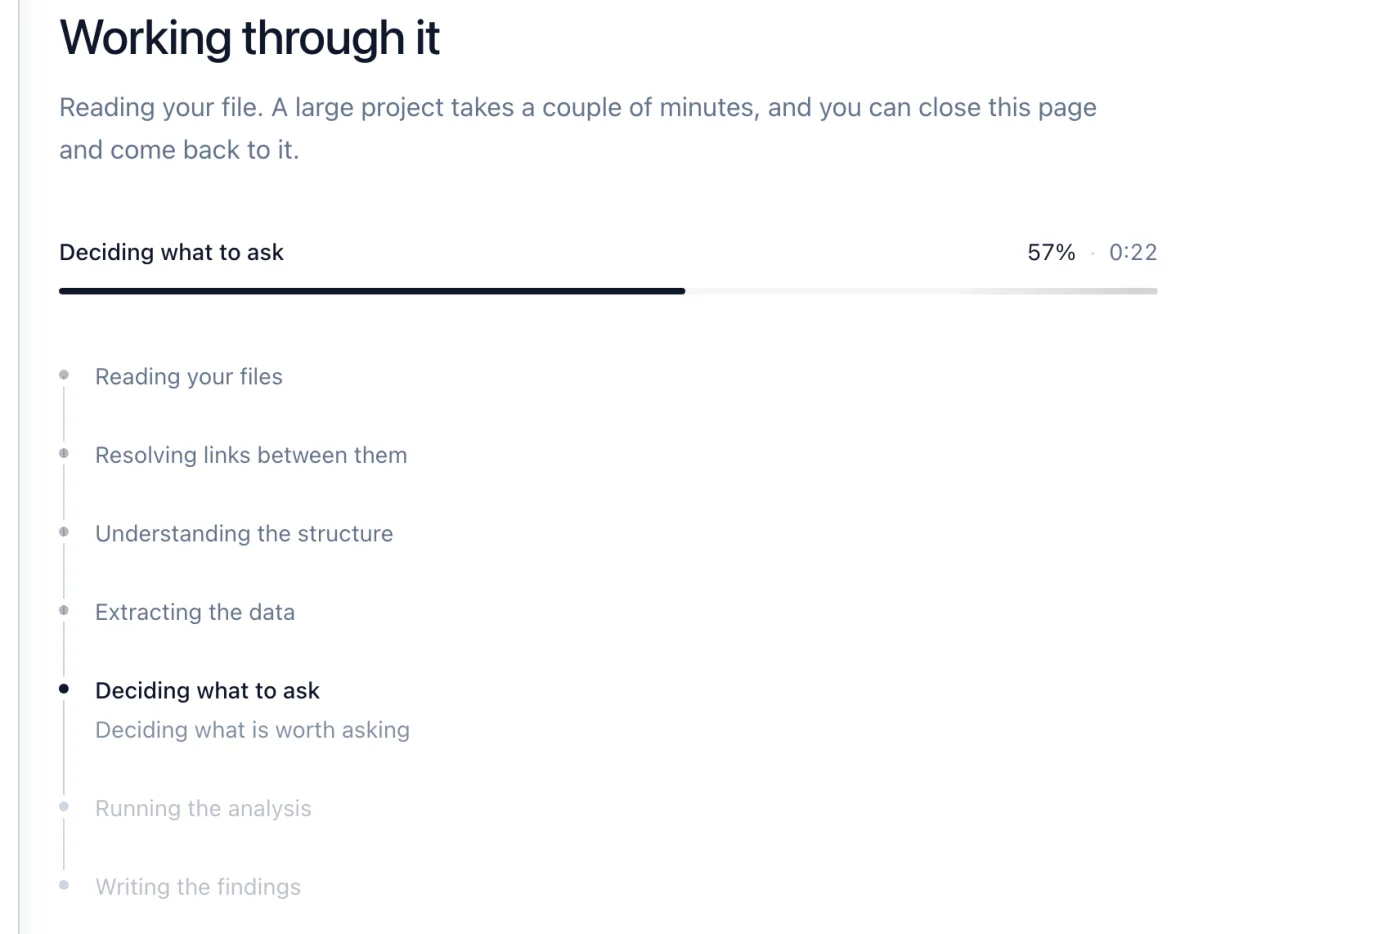
1. Create your account. Three analyses free, no card asked for.
What you get
This is the report, not a mock-up
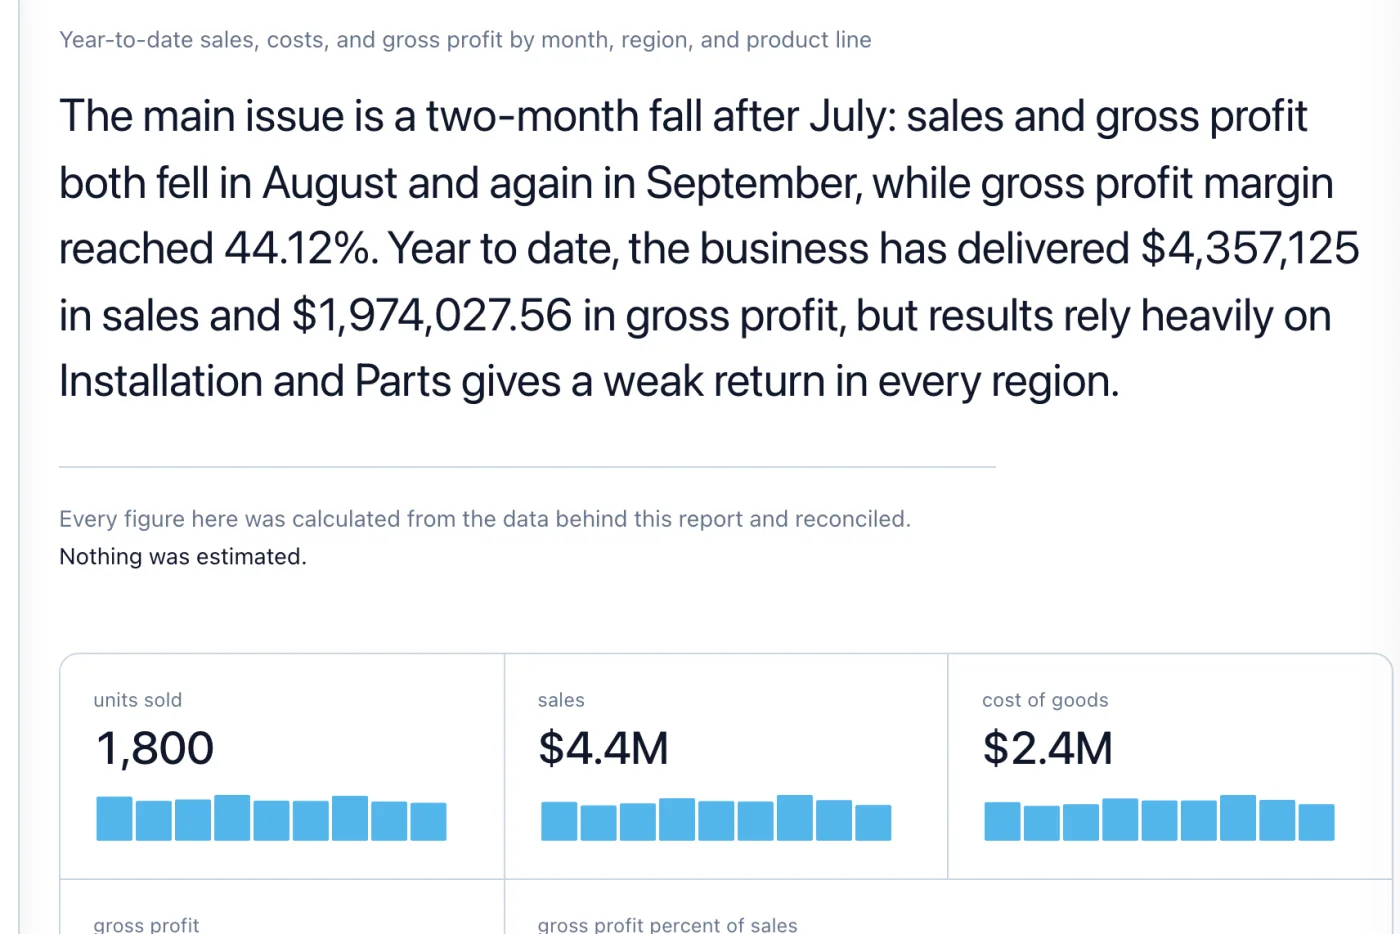
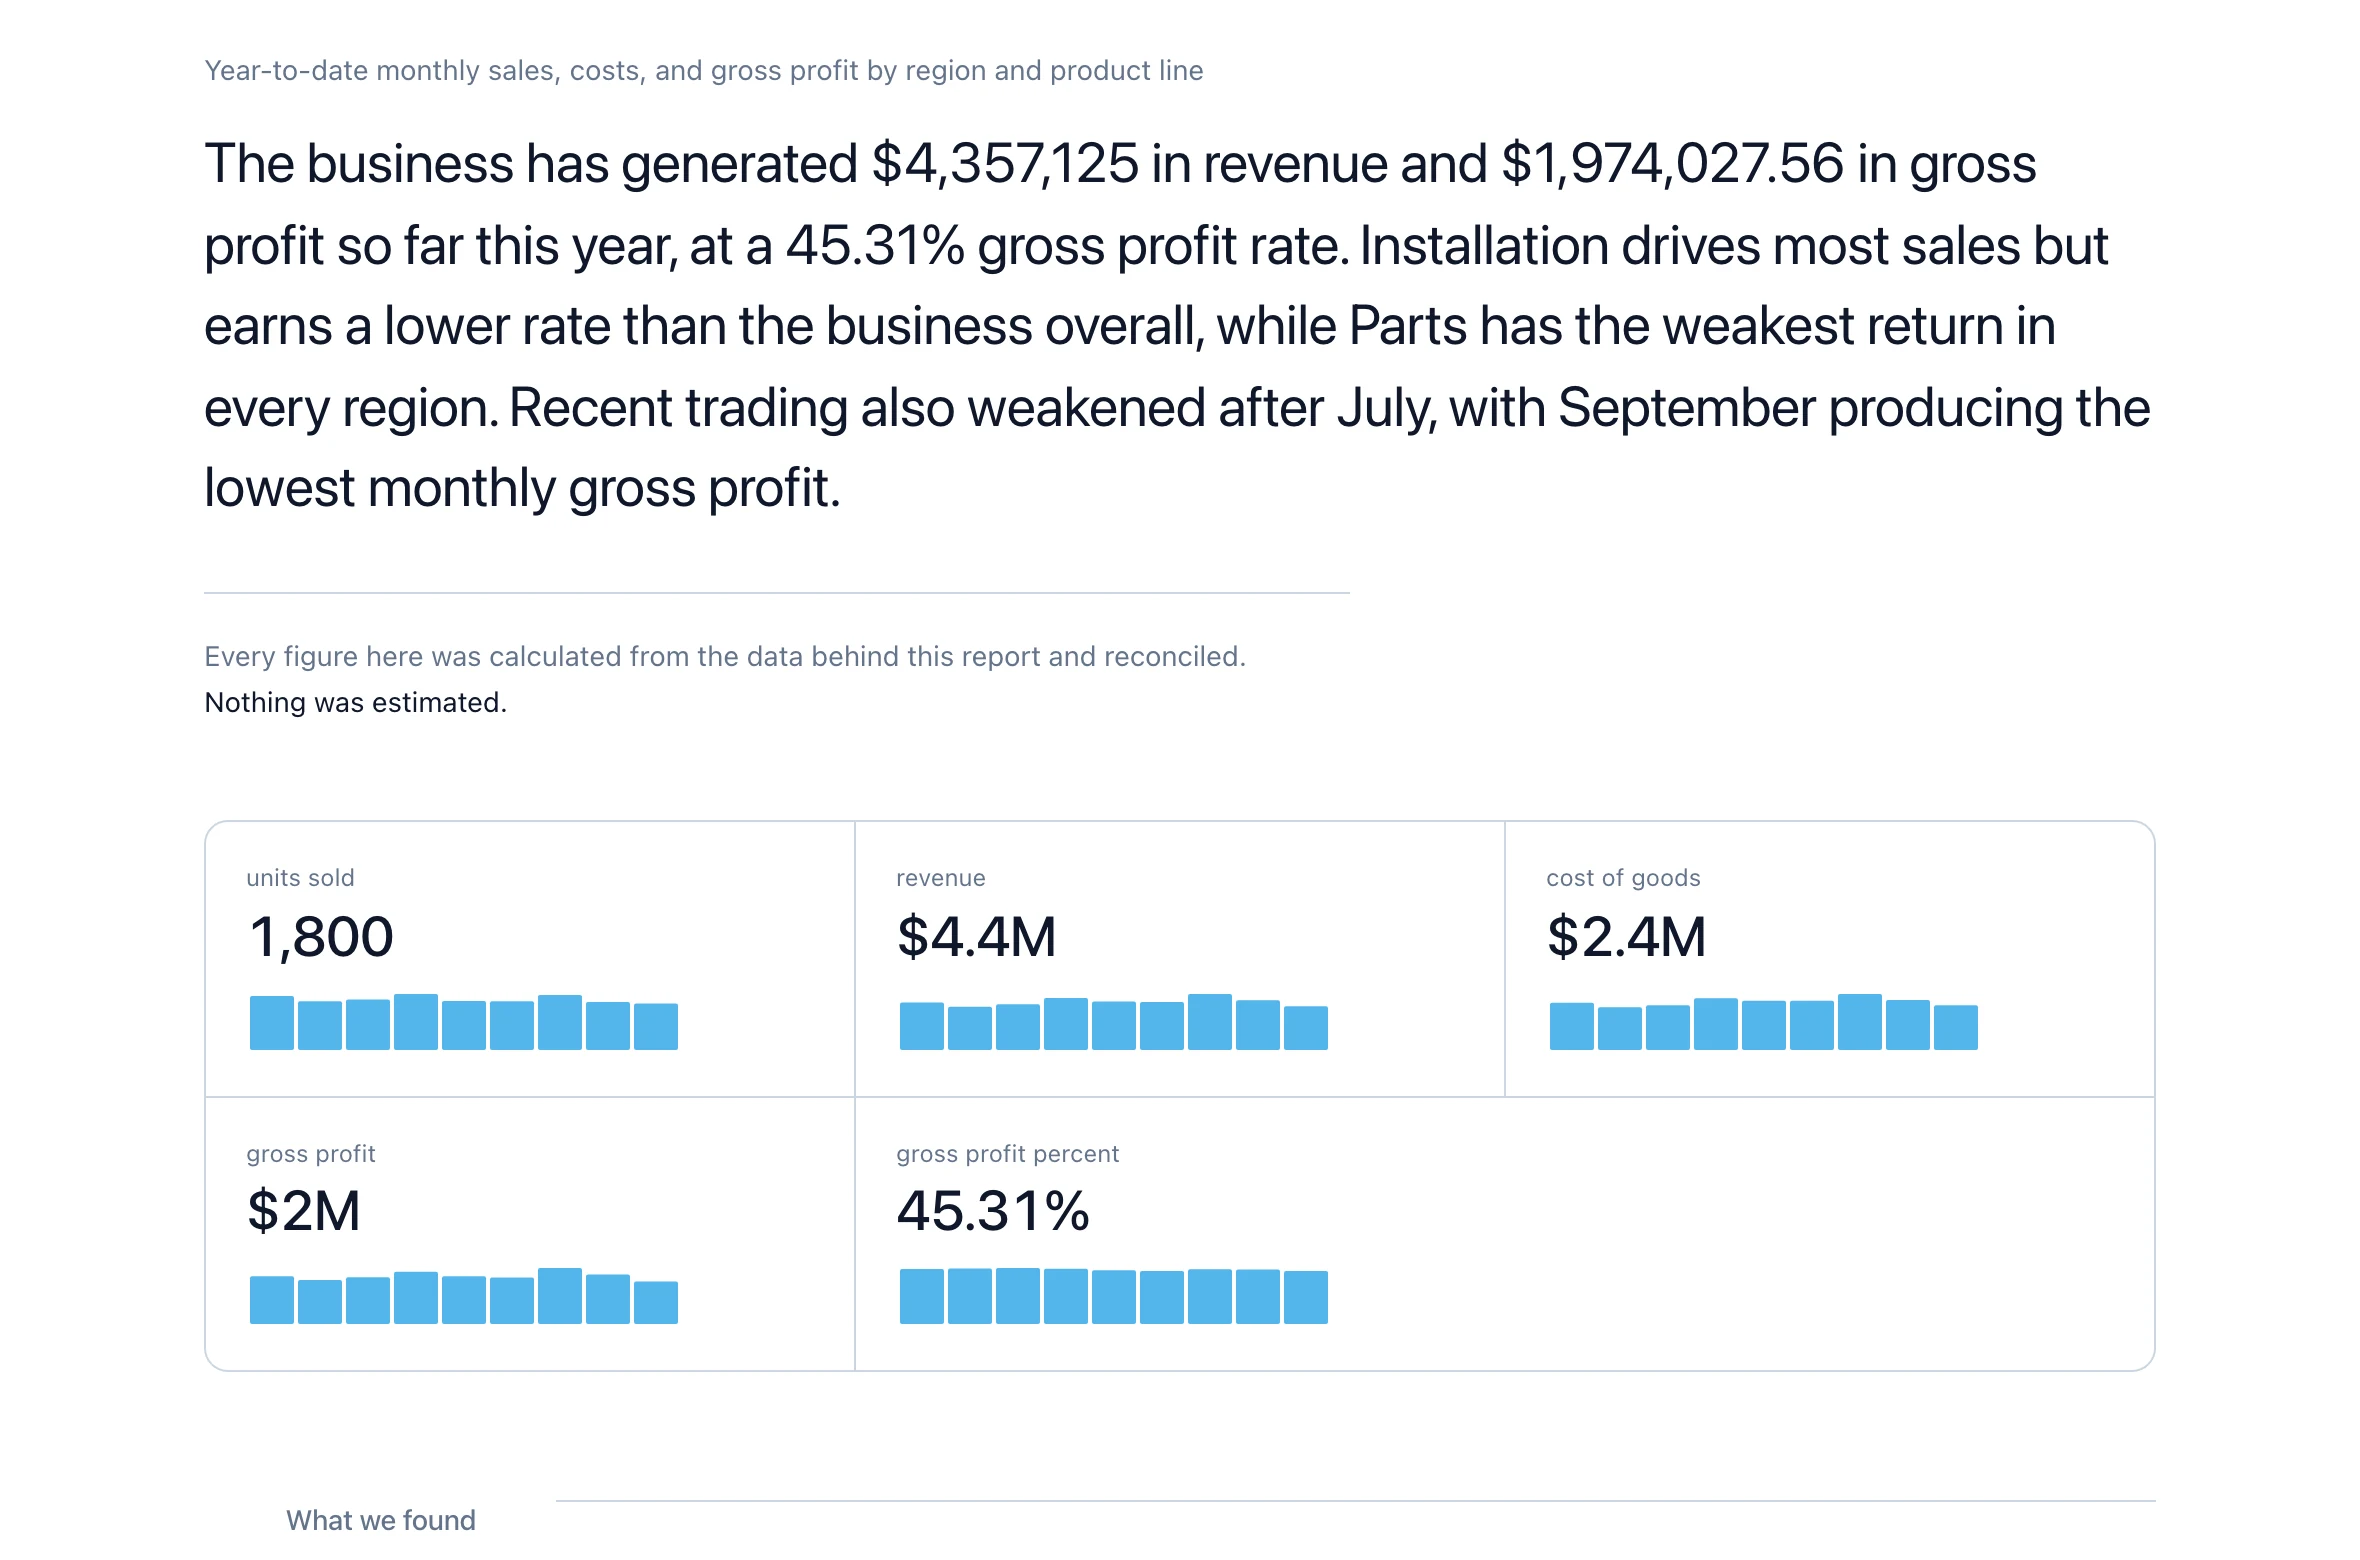
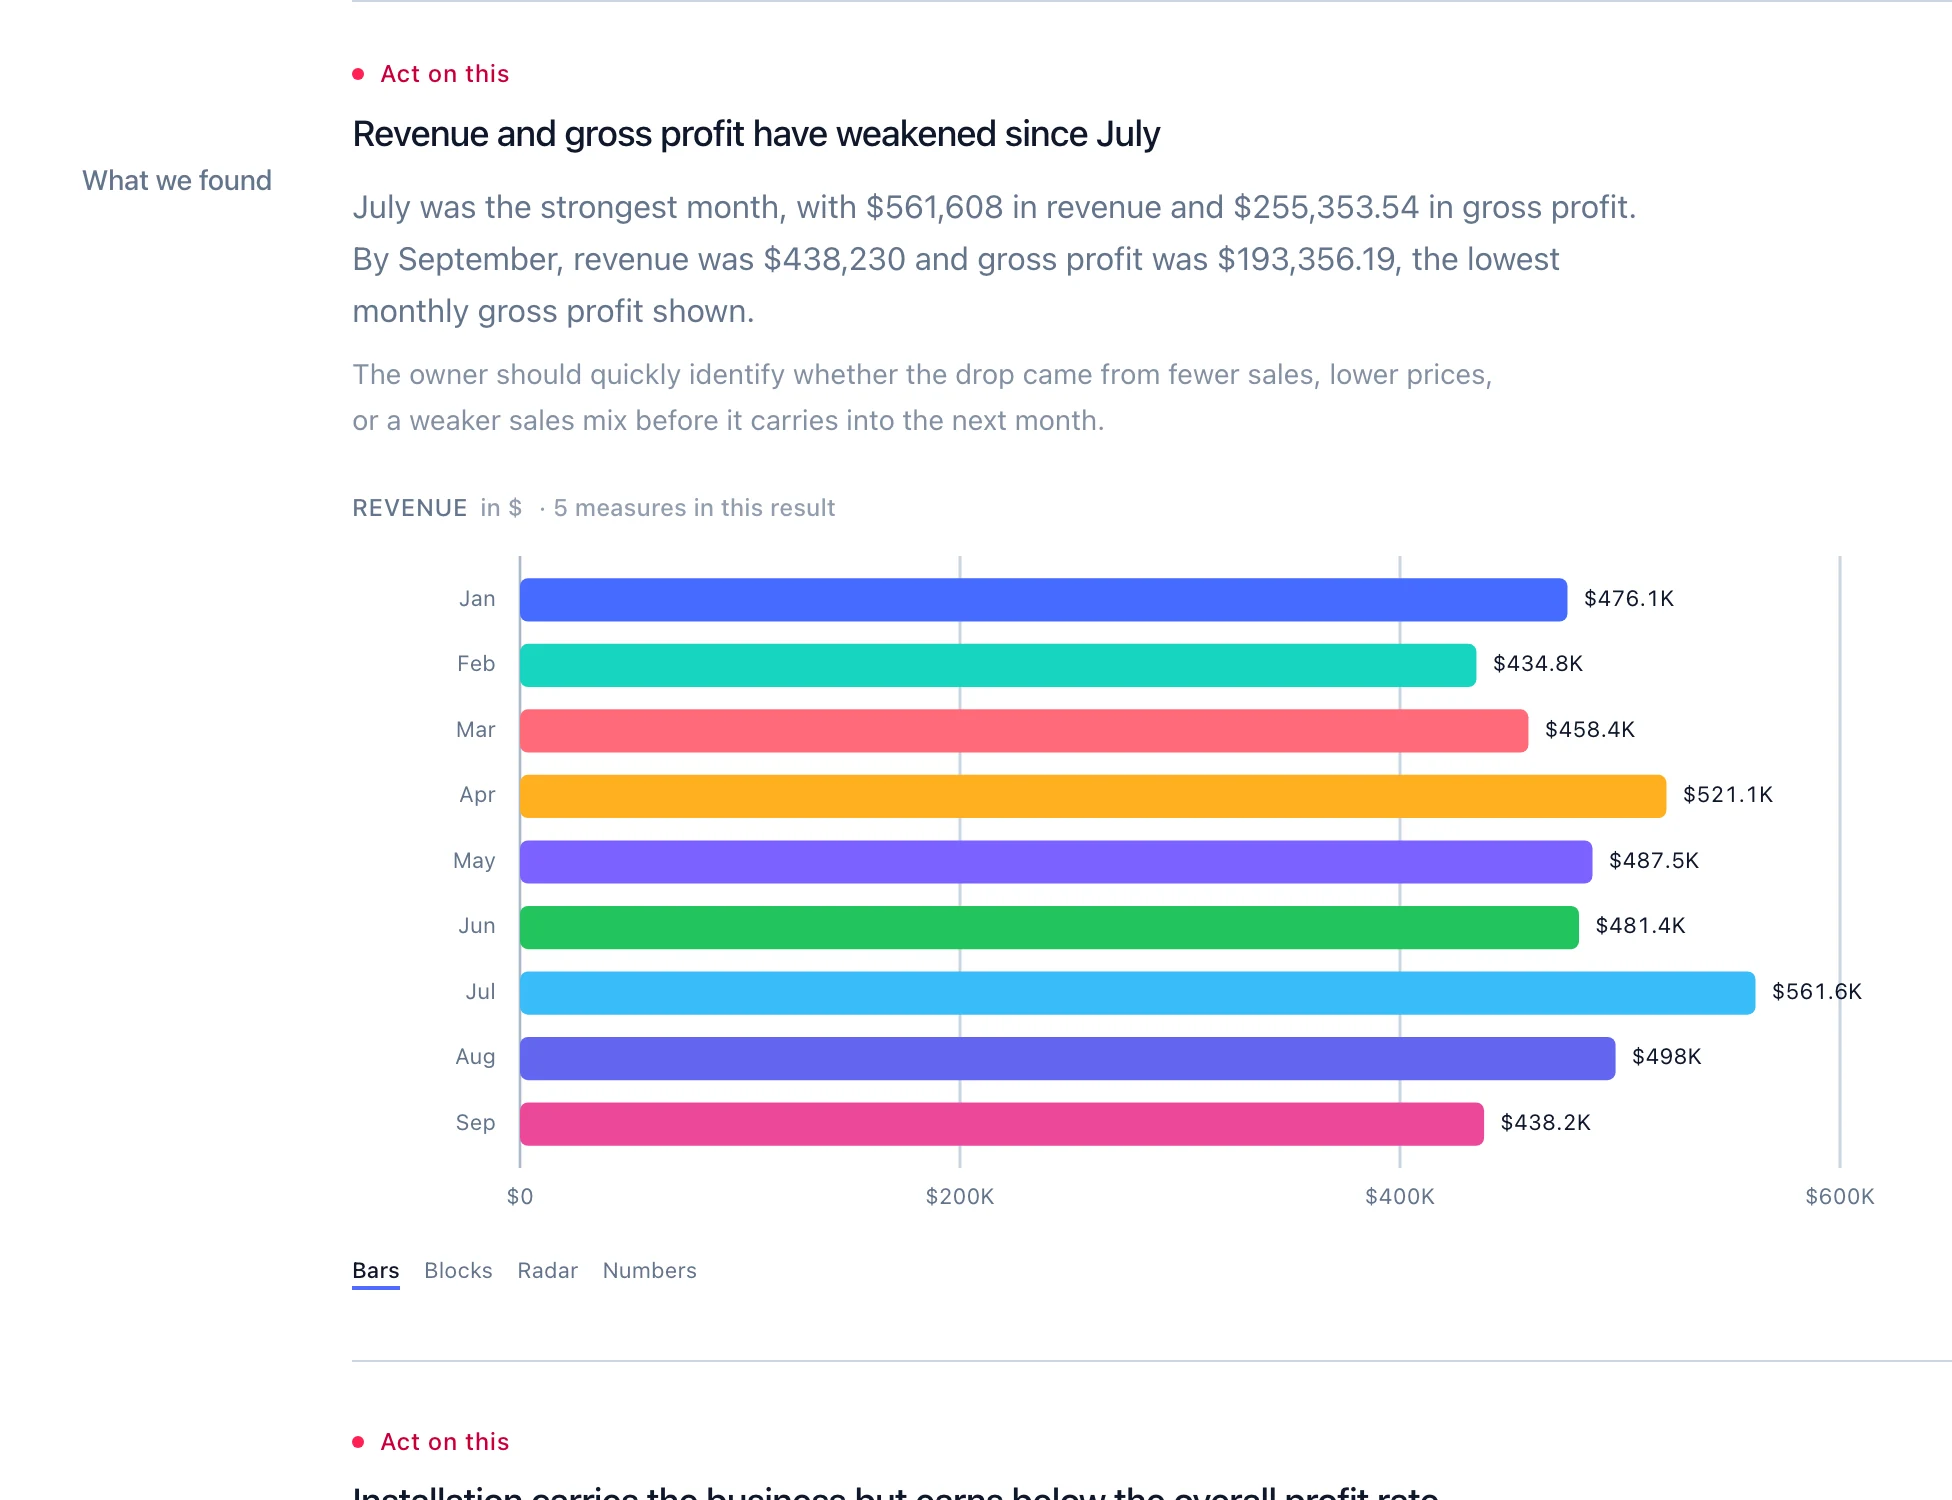
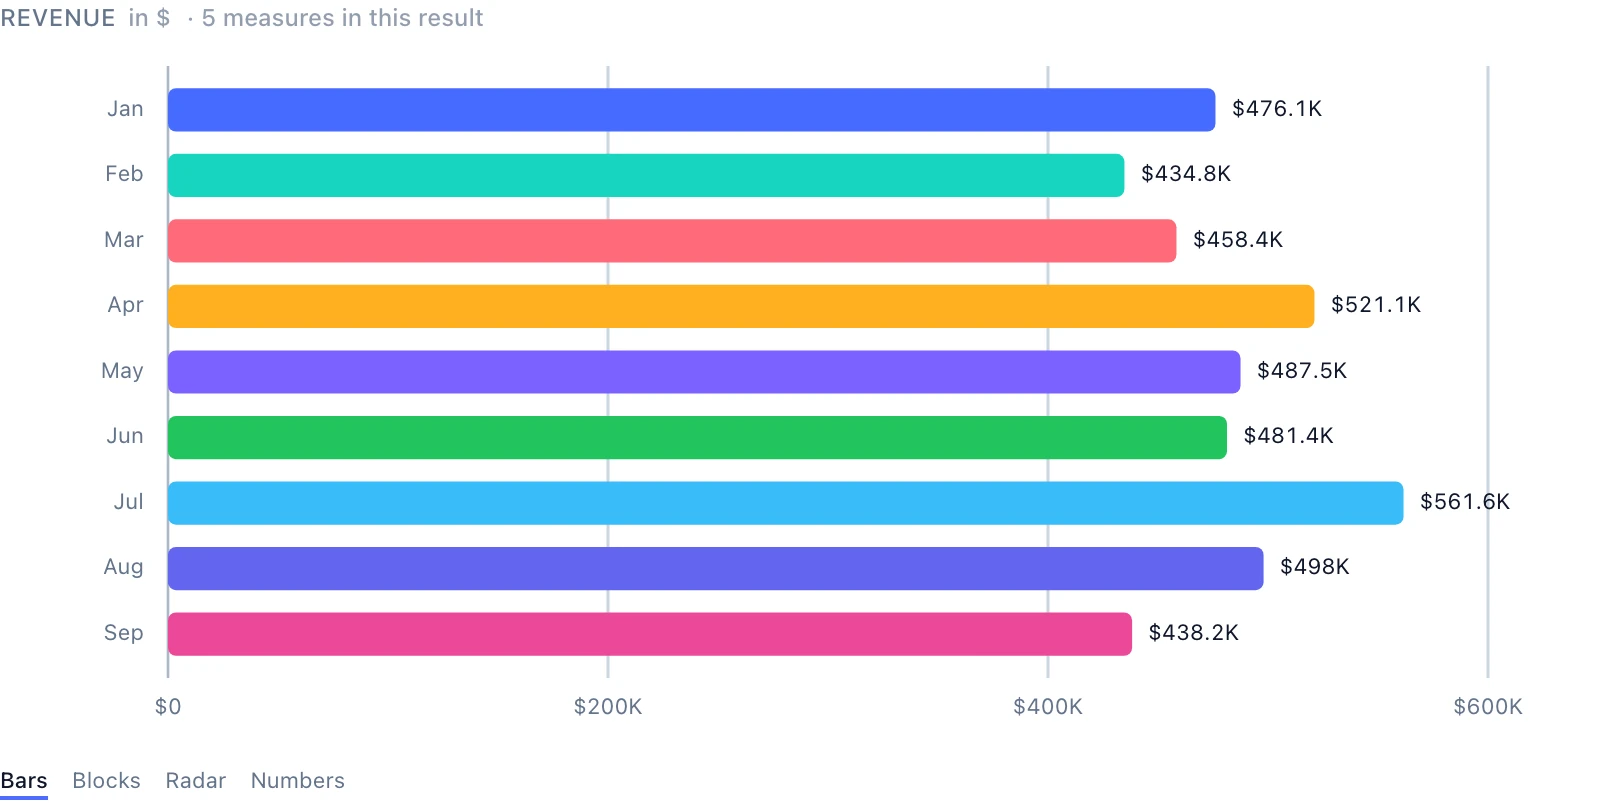
Produced by EZ Reports from a demonstration spreadsheet of a small installation business: nine months of sales, costs and gross profit by region and product line.
3 free analyses, no card needed.
Watch it work
A spreadsheet to a finished report, start to finish
The whole thing takes about 90 seconds, and the walkthrough is shorter than this paragraph suggests.
The walkthrough lands this week
Until then, the screenshots above are the real report, and the first three analyses are free if you would rather try it than watch it.
Why it can be trusted
A report you can defend in the meeting
Anything can write a paragraph about your data. The question your client will ask is where the number came from.
It reads the file you actually have
Not the file a template wishes you had.
- Title rows, merged cells, blank columns
- Workbooks that reference each other
- Excel, legacy .xls, and CSV
- Up to 25 MB per file
No mode to pick, no headers to promise, no template to fill in
Every figure can be checked
Click a sentence and see the numbers it came from.
- Findings written from executed results, never invented
- The numbers behind any chart, always one click away
- Says plainly how much of the analysis it managed
- Refuses a figure the data could not produce
The part a consultant can put their name to
Stop formatting reports. Start sending them.
Upload your first spreadsheet. No installation, no card, nothing to configure.
Supports .CSV, .XLS, and .XLSX · Delete your reports and files anytime