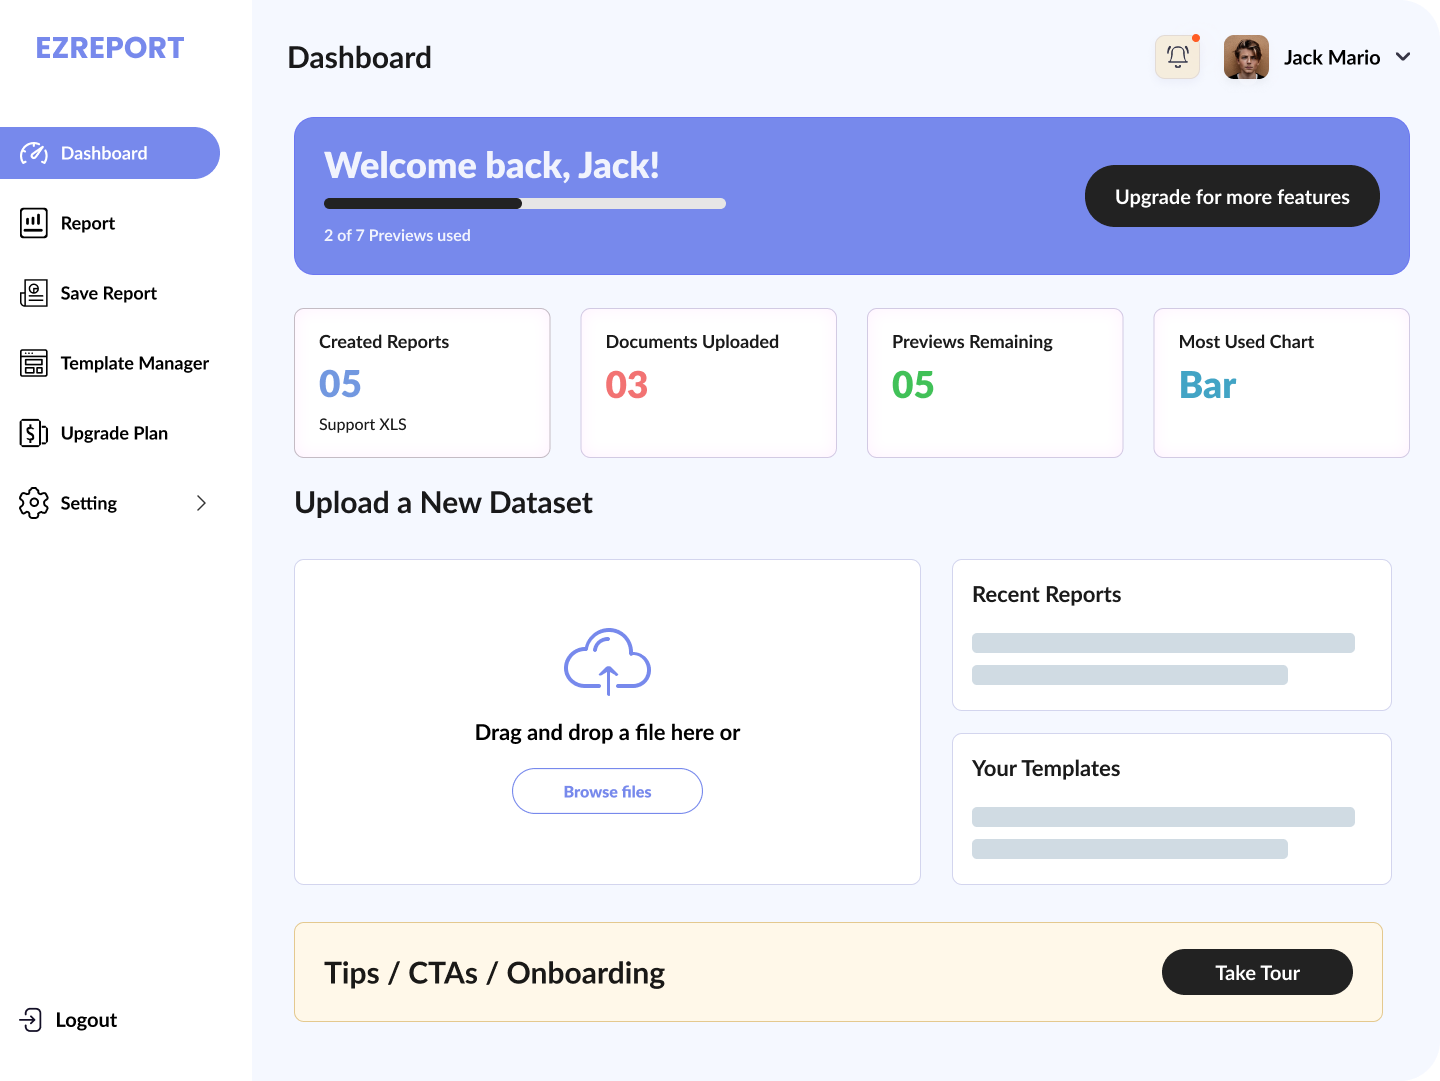
Upload any dataset, choose from multiple report templates, and generate stunning visualizations with charts, graphs, and tables. No technical skills required – just drag, drop, and create.
Support file formats including CSV, Excel. Automatic data cleaning and transformation with intelligent column mapping.
Create professional reports with predefined AI generated charts or custom configurations. Export to PDF, JPG, or PNG with one click.
Create stunning charts and graphs with our comprehensive visualization. Provides Advanced dashboard with filters and dynamic updates.
Leverage machine learning for predictive analytics, anomaly detection, and automated insights. Natural language queries to explore your data effortlessly.
Role-based access control with OAuth2 authentication. End-to-end encryption and compliance with industry security standards.
Use ezreports to create reports for any need—business, sales, marketing, operations, and more. Our step-by-step process makes it easy to turn your data into actionable insights and beautiful dashboards.
Everything you need for reporting, dashboard creation, and data visualization.
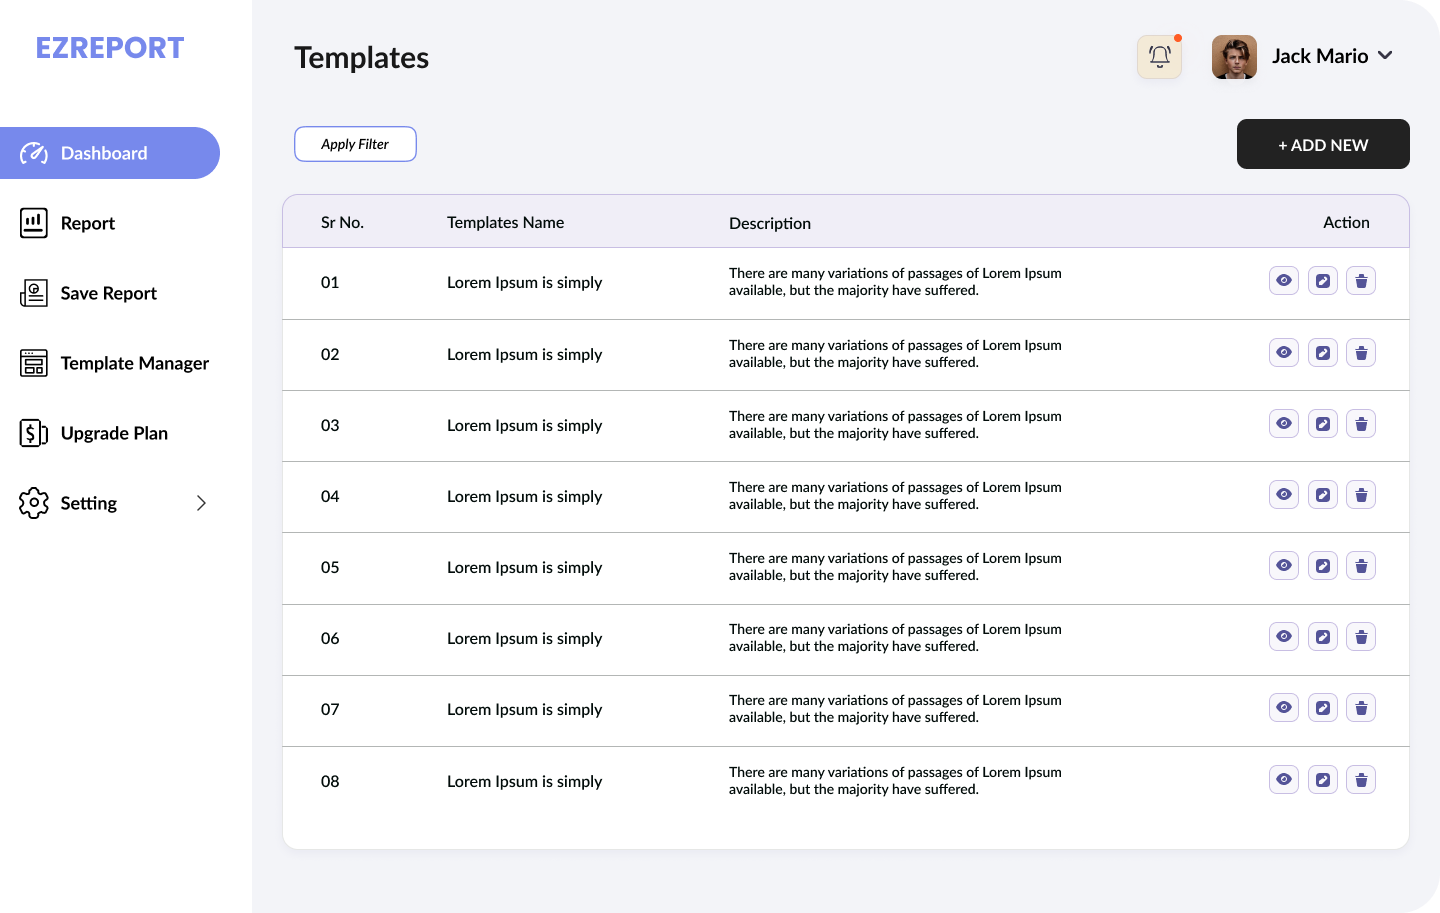
Choose from a variety of report templates for sales, projects, finance, and more. Tailor every detail to your needs.
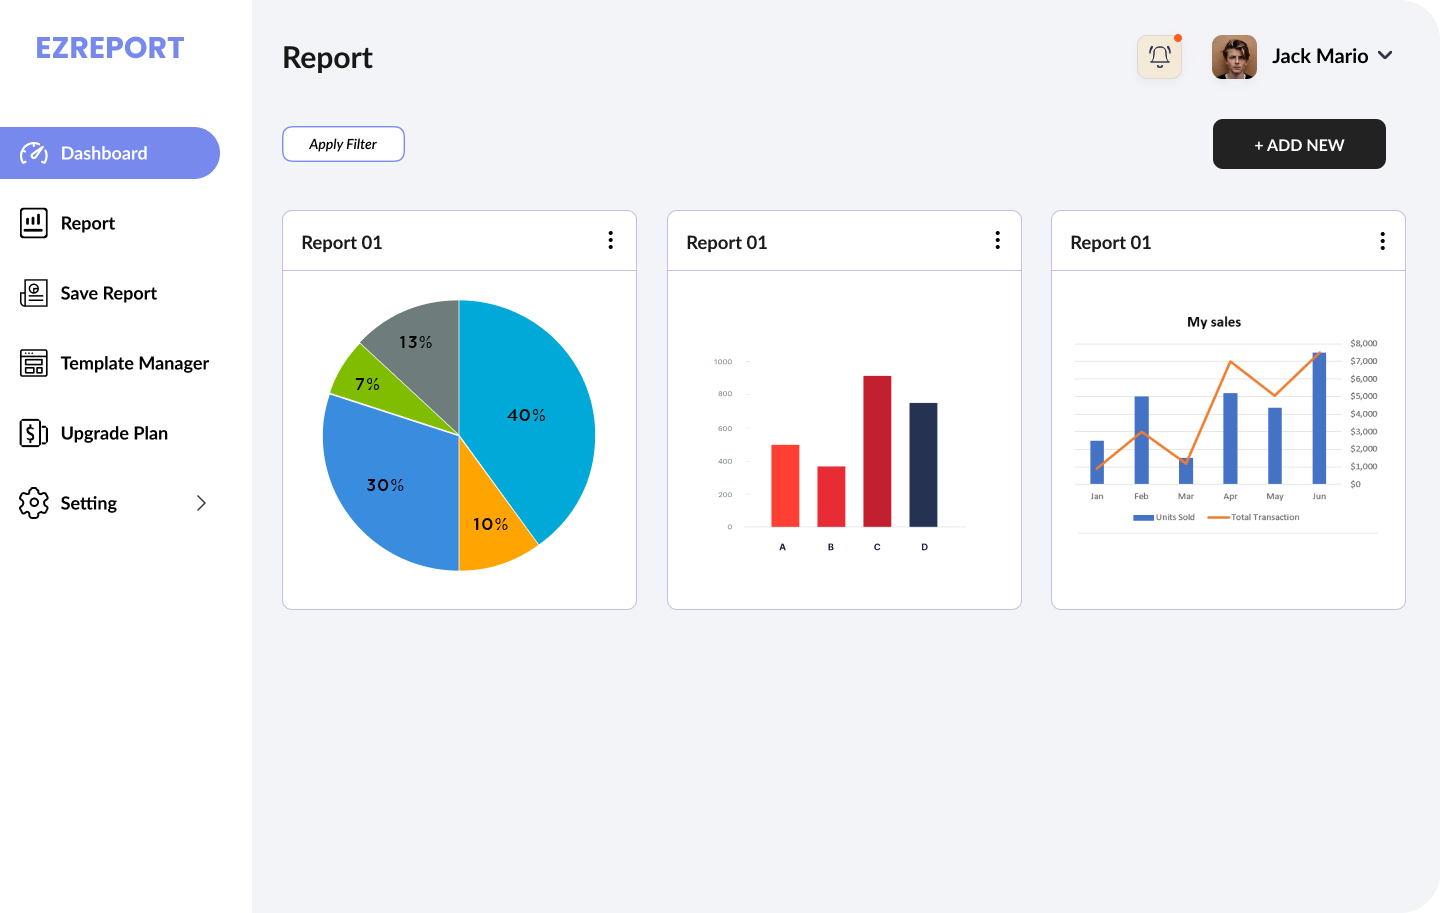
Visualize your data with charts, tables, and graphs. Drag-and-drop widgets for a personalized dashboard experience.

Get instant feedback and real-time analytics on your business performance. Export reports in PDF, Excel, or CSV.
Join thousands of professionals who trust EZREPORT for
their data visualization needs.
Choose the perfect plan for your team. Start free, upgrade when you need more power.
For individuals exploring (free for 5 days, converts to Starter after free period)
Perfect for individuals and small teams getting started
Ideal for small growing teams and businesses
For teams of 5 or more
For cross functional teams, multiple teams across an enterprise
We're here to help you succeed with data-driven reporting and analytics.